
How to Look Up Tarrant County Jail Population Data
The county keeps a live count on its Jail Population Dashboard. The Tarrant County Criminal Justice office calls it an interactive data report that gets updated on a regular basis to give a detailed view of who is in the jail. That dashboard is the right place for today's number, since a static article cannot keep pace with a count that changes hour to hour.
The dashboard sits with the county's jail and bond reporting tools, which you can reach from the Tarrant County jail and bond dashboard page.
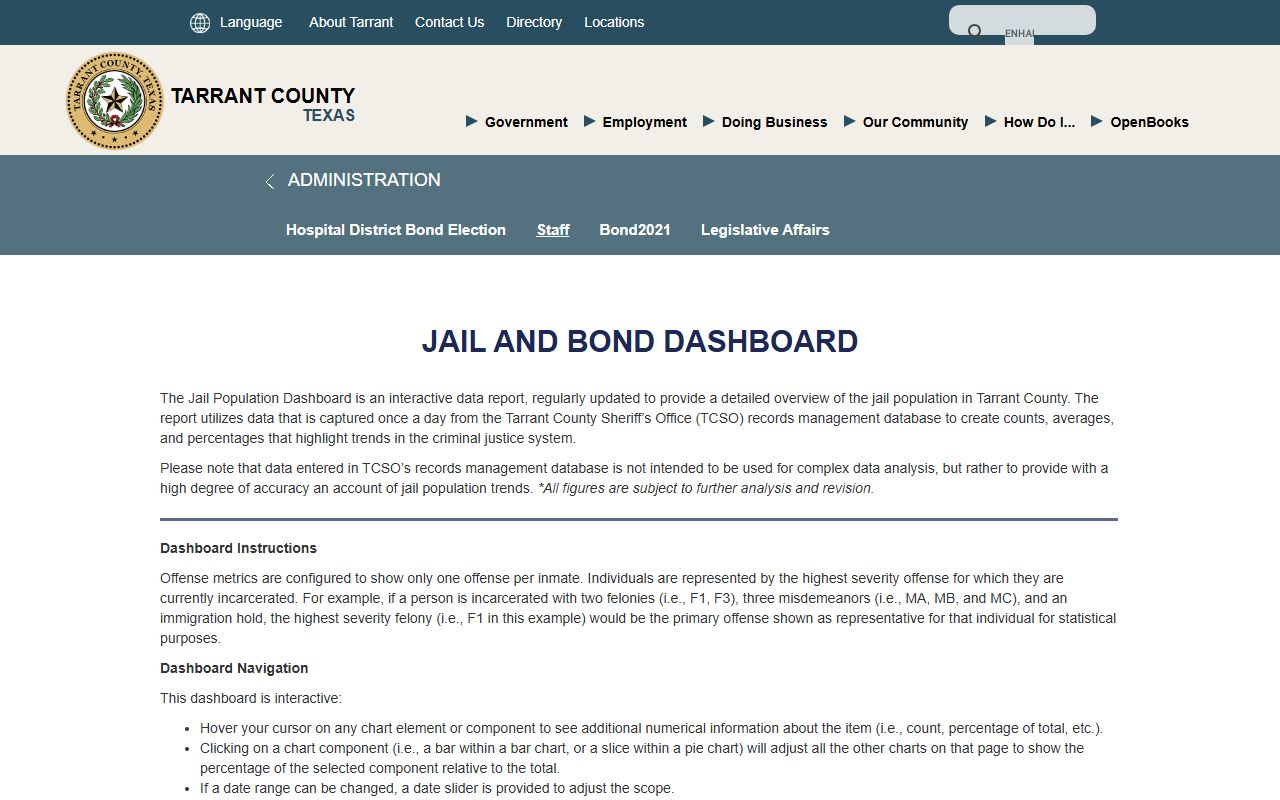
The dashboard tracks the live count and bond data side by side, so the population figure and the share held on bond move together as the day goes on.
Read the dashboard as a snapshot. The figures it shows are the county's own, pulled from booking and release records. State-level totals come from a separate source, the Texas Commission on Jail Standards, and those are filed once a month. So a county dashboard number and a state report number can differ by timing alone. Use the dashboard for the current count and the state reports for the official monthly comparison.
Tarrant County Jail Capacity Overview
The Detention Bureau states the Tarrant County Jail holds about 5,000 inmates and is made up of five facilities. That total is the rated bed count for the whole system, not the count of people in custody on a given day. Live counts run below the cap most of the time, and the daily figure is what the dashboard shows. The table below lists the system-wide capacity facts the county publishes. These are county figures, drawn from the Tarrant County Detention Bureau.
| Metric | County Figure |
|---|---|
| Total jail capacity | About 5,000 inmates |
| Number of facilities | Five |
| Detention staffing | About 1,000 certified officers |
| Annual bookings | About 35,000 a year |
| Meals served | About 10,250 hot meals per day |
| Court transfers | About 600 inmates per week |
| Lon Evans Correction Center size | 207,700 square feet, five stories |
Those numbers show the scale of the operation behind the count. A jail that books 35,000 people a year and feeds more than 10,000 meals a day is a big logistics job, and the population figure is just the visible tip of it.
The Five-Facility Tarrant County Jail System
The Tarrant County inmate population is not held in one building. It is spread across five facilities under the Detention Bureau. Central booking runs through the Tarrant County Corrections Center at 100 N. Lamar in Fort Worth. Everyone who is booked is received there first. The Sheriff's Office photographs each person, screens them, and enrolls them by iris before housing.
The Lon Evans Correction Center is the largest single piece of the system. It is a 207,700-square-foot, five-story maximum-security building, certified by the county in October 2012 and rated LEED Gold by the U.S. Green Building Council. Its kitchen is about 14,000 square feet and turns out roughly 10,250 hot meals a day for all five facilities. A registered dietician sets the menus, and special medical, dietary, or religious meals are made on request.
Where a person ends up depends on classification. Staff weigh custody level, gender, medical and mental-health needs, and which facility has room. That is why the system count matters more than any one building's number. People move between facilities as their status changes.
Tarrant County Corrections Center
100 N. Lamar
Fort Worth, TX 76196
817-884-3000
The Corrections Center is the front door for the whole system, so its booking volume drives the daily intake side of the population count.
Annual Bookings and Daily Intake
The Detention Bureau books about 35,000 inmates a year. That works out to a steady churn of intake and release behind the daily population number. The count you see on the dashboard is a balance point. People come in through central booking, and others leave through bond, dismissal, sentencing, or transfer.
Intake is not the same as population. A high booking year does not always mean a high daily count, because most people who are booked do not stay long. Many post bond or resolve a low-level charge fast. The population figure reflects who is still in custody, not the total who passed through. The county does not publish a single live daily count in a static page, so the dashboard remains the place to read the current number.
Booking volume also shapes staffing. With about 1,000 certified detention officers covering five facilities, the bureau plans around that 35,000-a-year flow.
Court Transfers and Population Movement
The jail moves about 600 inmates to various courts each week. That weekly transfer load is one reason the count never sits still. People held pretrial go back and forth between the jail and the courthouse for hearings, and the outcome of a hearing can change whether they stay or go.
Court activity and jail population are tied together. A bond ruling, a plea, or a sentence can each shift a person out of pretrial status. To track an individual case rather than the aggregate count, use the county court tools instead. You can start with Tarrant County court records for case files and dispositions.
Note: The roughly 600 weekly court transfers are a county figure from the Detention Bureau and reflect routine movement, not a one-time event.
State Jail Population Reports for Tarrant County
The Texas Commission on Jail Standards, or TCJS, is the state body that oversees county jails. It publishes monthly population and incarceration-rate reports for every county, including Tarrant. Under Government Code Section 511.0101, counties must send TCJS a jail population report by the fifth day of each month. That report lists capacity and the categories of inmates held.
Those monthly filings are the official record for capacity and population comparison over time. You can pull Tarrant's figures from the TCJS population reports.

The TCJS reports let you place the county's monthly number next to its rated capacity and against other Texas counties.
National and State Context for Jail Population
Two national bodies help put the Tarrant County inmate population in context. The Bureau of Justice Statistics, part of the U.S. Department of Justice, tracks jail and prison counts across the country. Its data is the standard national reference for incarceration rates. You can read its work at the Bureau of Justice Statistics.

BJS figures are national and state level, so they frame the bigger picture rather than the county's own daily count.
The Vera Institute of Justice publishes a parallel set of reports. Its national review of people in jail and prison gives a yearly snapshot, and you can read it through the Vera report on people in jail and prison.
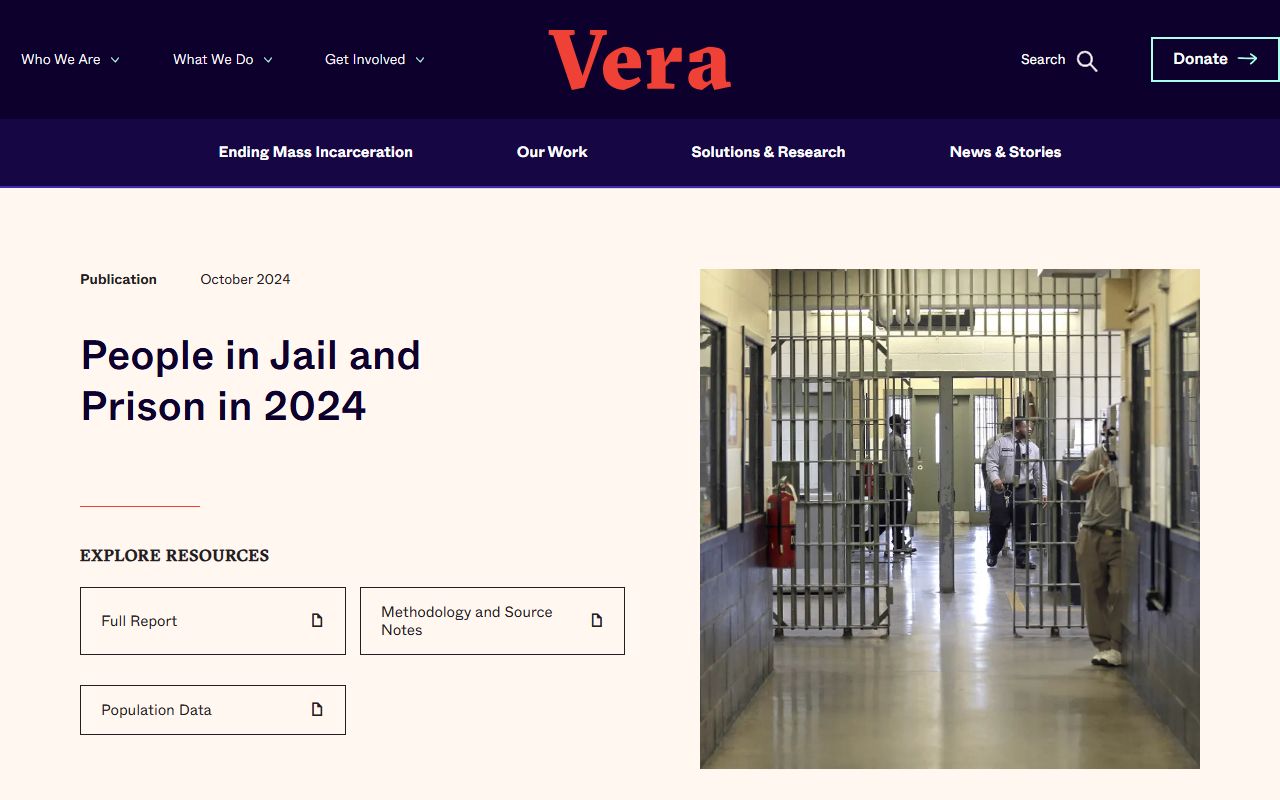
Vera's data shows how local jail use fits inside the larger U.S. trend, which helps when the county number alone lacks meaning.
The comparison block below mixes county facts with state context. The state figures come from Vera's Texas page and describe the whole state, not Tarrant County. Read them as background, not as the county's own breakdown.
| Level | Figure | What It Describes |
|---|---|---|
| Tarrant County | About 5,000-bed capacity, five facilities | County jail system size |
| Texas (state context) | 69% held pretrial | Share of the statewide jail population awaiting trial |
| Texas (state context) | 1,003,592 jail admissions a year | Annual local jail admissions across the whole state |
The state pretrial share is useful as a benchmark. Most people in Texas jails are there before any conviction, which is the pattern most county systems follow.
Pretrial and Sentenced Population
Jail population splits into two broad groups. One group is held pretrial, meaning they are charged but not yet convicted. The other group is serving a sentence, usually for a misdemeanor or while waiting on transfer. The dashboard and the monthly TCJS report break this out for Tarrant County, since the categories are part of the required state filing.
Statewide, the split leans heavily toward pretrial. Vera's Texas data reports that 69 percent of the state jail population is held pretrial. That is a state figure, not a Tarrant County count, but it shows why bond policy drives so much of any county's number. When more people can make bond, the pretrial share drops and the daily count tends to fall with it.
For Tarrant's exact pretrial-versus-sentenced split on a given day, the dashboard is the live source and the TCJS monthly report is the official one.
Population Trends and Recent Oversight
The Tarrant County jail population has drawn close attention in recent years. The picture below is recent public oversight context. It is not a set of adjudicated findings, and it does not replace the live count.
In April 2024, the Fort Worth Report said county commissioners paused a plan to overhaul the criminal courts and instead set up an 11-person working group aimed at reducing the jail population and preventing fraud in the justice system. In June 2024, KERA reported that the Tarrant County Medical Examiner ruled the jail death of Anthony Johnson Jr. a homicide by asphyxiation. That ruling raised scrutiny of jail use-of-force and custody practices.
The criminal and civil paths that followed were separate. Coverage in 2024 noted that the death led to murder charges and the firing of jailers. In February 2025, CBS Texas reported that a judge dismissed Tarrant County from a civil suit filed by the family while the criminal case continued. A dismissal of the county from the civil suit did not resolve the criminal proceedings, which moved on their own track.
Oversight talk carried into 2025. KERA reported that North Texas lawmakers pushed for changes in how jail deaths are investigated, and that commissioners wanted a process for compassionate-release cases for medically vulnerable inmates. NBC DFW reported that Sheriff Bill E. Waybourn gave commissioners an in-custody death update and reported six in-custody deaths in 2025. For live counts in 2026 and beyond, the county dashboard and current TCJS reports are the sources to check.
The Vera Institute also tracks Texas incarceration over time. You can follow the state trend through the Vera Texas incarceration trends page.
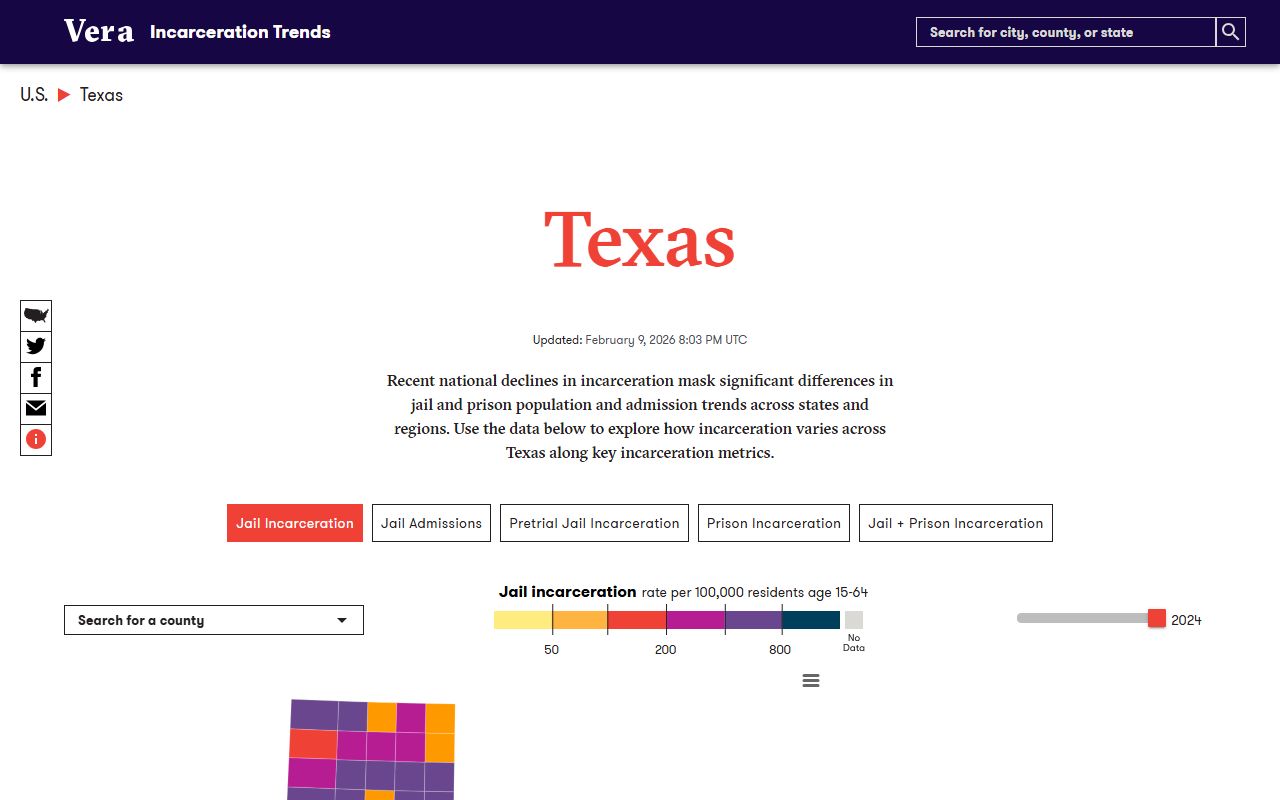
The Vera Texas trend view sets the long arc of state jail use against the county's more recent oversight history.
Searching for Tarrant County Inmate Records by Name
This page covers the aggregate jail population, not one person. For a name-based search of the live jail roster, use the Tarrant County inmate records page, which explains the Sheriff's inmate lookup and what a result shows. To find someone after release, see released inmates.
Where the Data Comes From
The county figures here come from the Tarrant County Sheriff's Office and its Detention Bureau, which publish capacity facts and the live jail and bond dashboard. The official monthly counts come from the TCJS population reports, filed under state law.
National and state context comes from the Bureau of Justice Statistics and the Vera Institute of Justice, including its national jail and prison report and its Texas trends page. County numbers and outside benchmarks are kept separate on purpose, since each answers a different question.
Note: County dashboard counts and state monthly reports can differ by timing, so check the date on any figure before you rely on it.